A software engineer’s practical guide to mastering model evaluation metrics
After tackling my first machine learning project with the Titanic dataset, I thought I had the evaluation metrics down---accuracy was king, right? Well, not quite. I kept getting scores that looked great, but when I looked at the details, my model was terrible at identifying survivors. That’s when I discovered the F1-Score and learned why it’s so important for imbalanced datasets.
If you’re coming from a software background like me, you’re used to binary outcomes---code either works or it doesn’t, tests pass or fail. But ML evaluation metrics have more nuance, and understanding this is crucial for building models that actually perform well in the real world.
The Accuracy Trap: Why Simple Measures Can Mislead
When I first approached the Titanic problem, I was getting accuracy scores around 80% and feeling pretty good about my models. Then I did the math and realized something wasn’t right. In the training set, about 62% of passengers died, while 38% survived.
This means I could achieve 62% accuracy by simply predicting that everyone died. My 80% accuracy didn’t seem so impressive anymore---I might just be making a slightly more sophisticated version of the same mistake.
What I Learned: Accuracy alone is misleading on imbalanced datasets. If 95% of your data belongs to one class, a model that always predicts the majority class will have 95% accuracy but be completely useless for the minority class.
Here’s a simple example I used to understand this:
# What happens with a naive predictor on imbalanced data?
import pandas as pd
import numpy as np

# Simulate imbalanced dataset like Titanic (62% died, 38% survived)
y_true = [0]*620 + [1]*380  # 62% died (0), 38% survived (1)

# Naive model that always predicts "died"
y_pred_naive = [0]*1000

naive_accuracy = np.mean([a == b for a, b in zip(y_true, y_pred_naive)])
print(f"Naive model accuracy: {naive_accuracy:.3f}")  # 0.620

# But recall for survivors? 0% - it never predicts survival!
survivors_correctly_identified = sum([1 for true, pred in zip(y_true, y_pred_naive)
                                      if true == 1 and pred == 1])
actual_survivors = sum(y_true)
naive_recall = survivors_correctly_identified / actual_survivors if actual_survivors > 0 else 0
print(f"Naive model recall for survivors: {naive_recall:.3f}")  # 0.000

# Output:
# Naive model accuracy: 0.620
# Naive model recall for survivors: 0.000
Lesson: Always look beyond accuracy, especially with imbalanced data.
Precision vs. Recall: The Core Trade-off
Before diving into F1-Score, I had to understand the fundamental trade-off between precision and recall. Coming from software development, I thought of these as somewhat similar, but they’re actually measuring different aspects of model performance.
Precision: “Of the passengers I said would survive, how many actually did?”
Precision = True Positives / (True Positives + False Positives)
In the Titanic context, if my model predicts 100 people will survive, precision tells me how many of those 100 actually survived. High precision means when I predict survival, I’m usually right.
What I Do: Ask, “Can I trust my positive predictions?” Precision matters when false positives are costly. For example, if I’m flagging people for a rescue boat with limited space, I want to be sure they actually need it.
Recall: “Of all the passengers who actually survived, how many did I correctly identify?”
Recall = True Positives / (True Positives + False Negatives)
In the Titanic context, if 380 people survived, recall tells me how many of those 380 I correctly identified. High recall means I’m finding most of the survivors.
What I Do: Ask, “Am I missing many positive cases?” Recall matters when false negatives are costly. If I’m missing actual survivors, I could be leaving people behind who could be rescued.
The Trade-off Reality
Here’s what I learned through experimentation:
from sklearn.metrics import precision_score, recall_score
import numpy as np

# Example of precision-recall trade-off
y_true = [0, 0, 0, 0, 1, 1, 1, 1]
y_pred_conservative = [0, 0, 0, 0, 0, 1, 0, 0]  # Very selective - high precision, low recall
y_pred_aggressive = [0, 1, 1, 1, 1, 1, 1, 1]    # Very inclusive - low precision, high recall

print(f"Conservative model - Precision: {precision_score(y_true, y_pred_conservative):.2f}, "
      f"Recall: {recall_score(y_true, y_pred_conservative):.2f}")

# Output:
# Precision: 1.00, Recall: 0.25

print(f"Aggressive model - Precision: {precision_score(y_true, y_pred_aggressive):.2f}, "
      f"Recall: {recall_score(y_true, y_pred_aggressive):.2f}")

# Output:
# Precision: 0.67, Recall: 1.00
Lesson: You can’t maximize both precision and recall simultaneously. Improving one often comes at the cost of the other.
Enter F1-Score: The Balanced Metric
So if I can’t optimize for both precision and recall at once, how do I find a good balance? That’s where F1-Score comes in.
F1-Score is the harmonic mean of precision and recall:
F1 = 2 * (Precision * Recall) / (Precision + Recall)
Why harmonic mean? A simple average would let one high value compensate for a low one, but harmonic mean is more sensitive to low values. This means both precision and recall need to be reasonably high for F1-Score to be high.
Why This Matters for Imbalanced Data
In the Titanic dataset, I care about identifying survivors correctly. If my model has high recall but low precision, I might flag lots of people who didn’t actually survive. If it has high precision but low recall, I might miss many actual survivors. F1-Score helps me find the right balance.
Here’s how I implement F1-Score evaluation:
from sklearn.metrics import f1_score, classification_report
from sklearn.ensemble import RandomForestClassifier
from sklearn.model_selection import train_test_split

# Assuming you have your preprocessed data ready
# X, y = your features and target
X_train, X_test, y_train, y_test = train_test_split(X, y, test_size=0.2, random_state=42)

# Train a model
model = RandomForestClassifier(n_estimators=100, random_state=42)
model.fit(X_train, y_train)

# Make predictions
y_pred = model.predict(X_test)

# For probability-based metrics, get prediction probabilities
y_pred_proba = model.predict_proba(X_test)[:, 1]  # Probabilities for positive class (survived)

# Calculate metrics
f1 = f1_score(y_test, y_pred)
print(f"F1-Score: {f1:.3f}")

# Get detailed report
print("\\nDetailed Classification Report:")
print(classification_report(y_test, y_pred))

#Output:
F1-Score: 0.778
#Detailed Classification Report:
#               precision    recall  f1-score   support

#            0       0.83      0.87      0.85       105
#            1       0.80      0.76      0.78        74

#     accuracy                           0.82       179
#    macro avg       0.82      0.81      0.81       179
# weighted avg       0.82      0.82      0.82       179
What I Look For: In imbalanced datasets, I often find the F1-Score for the minority class (survived=1) more informative than overall accuracy.
When to Use F1-Score vs. Other Metrics
I learned that F1-Score isn’t always the right choice. Here’s my decision framework:
Use F1-Score When:
- You have imbalanced datasets (like Titanic: 62% died, 38% survived)
- Both false positives and false negatives matter equally
- You want a single metric that balances precision and recall
- You’re doing binary classification with meaningful minority classes
Use Accuracy When:
- Your dataset is balanced (roughly equal numbers in each class)
- You care equally about all types of errors
- You’re doing multiclass classification where you want overall performance
Use Precision When:
- False positives are more costly than false negatives
- You’re building a spam detector (you don’t want to mark legitimate email as spam)
- You’re flagging high-risk individuals (false alarms are problematic)
Use Recall When:
- False negatives are more costly than false positives
- You’re doing medical screening (you don’t want to miss actual diseases)
- You’re identifying potential safety issues (missing a risk is worse than a false alarm)
Use ROC-AUC When:
- You want to evaluate how well your model ranks predictions
- You’re comparing models across different thresholds
- You want to assess performance across various decision thresholds
Practical Example: For Titanic, I care about both missing survivors (recall) and incorrectly flagging people who died as survivors (precision). The F1-Score gives me a balanced view, though I might weight recall slightly higher since missing survivors could be more consequential.
Practical Implementation: Optimizing for F1-Score
In my early experiments, I was focusing on accuracy and getting suboptimal results. Here’s how I shifted to optimizing for F1-Score:
from sklearn.model_selection import GridSearchCV
from sklearn.metrics import make_scorer, f1_score

# Define F1 scorer
f1_scorer = make_scorer(f1_score, average='weighted')

# Set up grid search with F1 optimization
param_grid = {
    'n_estimators': [50, 100, 200],
    'max_depth': [3, 5, 7, None],
    'min_samples_split': [2, 5, 10],
    'min_samples_leaf': [1, 2, 4]
}

grid_search = GridSearchCV(
    RandomForestClassifier(random_state=42),
    param_grid,
    scoring=f1_scorer,  # Optimize for F1-Score
    cv=5,
    n_jobs=-1
)

grid_search.fit(X_train, y_train)

print(f"Best F1-Score: {grid_search.best_score_:.3f}")
print(f"Best parameters: {grid_search.best_params_}")

#Output:
# Best F1-Score: 0.829
# Best parameters: {'max_depth': 5, 'min_samples_leaf': 1, 'min_samples_split': 2, 'n_estimators': 100}
What I Learned: Optimizing directly for F1-Score often yields better models for imbalanced problems than optimizing for accuracy.
Tools and Libraries I Use
Scikit-learn Functions:
f1_score()- Calculate F1-Scoreclassification_report()- Get precision, recall, F1-Score, and support for all classesmake_scorer()- Create custom scoring functions for model evaluationGridSearchCV- Automating Hyperparameter tuning
Visualization Tools:
import matplotlib.pyplot as plt
from sklearn.metrics import confusion_matrix, ConfusionMatrixDisplay

# Visualize results
cm = confusion_matrix(y_test, y_pred)
disp = ConfusionMatrixDisplay(confusion_matrix=cm, display_labels=['Died', 'Survived'])
disp.plot(cmap='Blues')
plt.title(f'Confusion Matrix (F1-Score: {f1_score(y_test, y_pred):.3f})')
plt.show()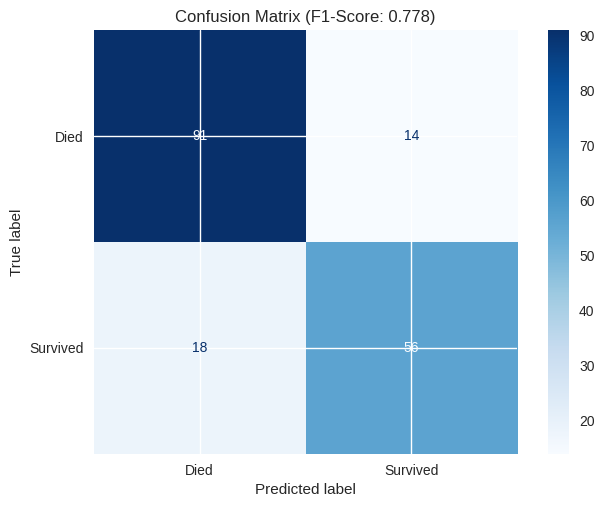
Advanced Metrics for Deep Dive:
For more detailed analysis, I sometimes use additional metrics:
from sklearn.metrics import precision_recall_curve, average_precision_score

# Precision-Recall curve (especially useful for imbalanced datasets)
precision, recall, thresholds = precision_recall_curve(y_test, y_pred_proba)
avg_precision = average_precision_score(y_test, y_pred_proba)

plt.figure(figsize=(8, 6))
plt.plot(recall, precision, label=f'Precision-Recall Curve (AP = {avg_precision:.2f})')
plt.xlabel('Recall')
plt.ylabel('Precision')
plt.title('Precision-Recall Curve')
plt.legend()
plt.grid(True)
plt.show()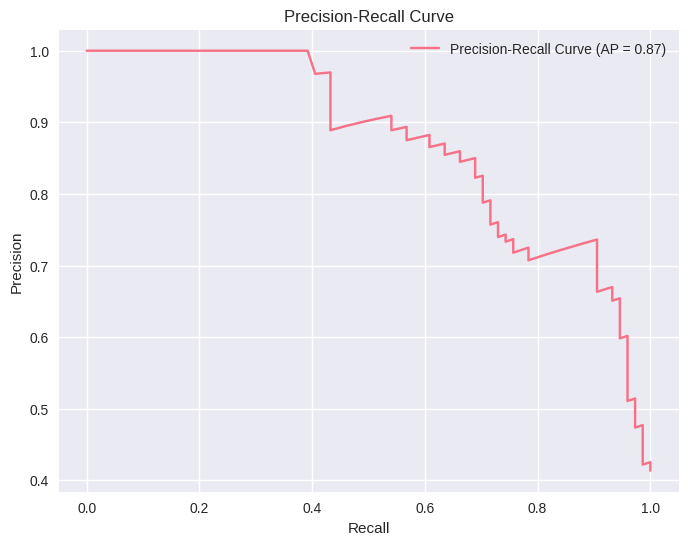
Red Flags and Gotchas I’ve Learned From
1. Micro vs Macro vs Weighted Average
When dealing with multiclass problems, choose your averaging method wisely:
micro: Calculate metrics globally by counting total true positives, false negatives, etc.macro: Calculate metrics for each class and take the unweighted meanweighted: Calculate metrics for each class and find their average weighted by support
2. F1-Score Can Still Be Misleading
F1-Score can look good overall but hide poor performance for minority classes in multiclass problems.
3. Threshold Matters
The default 0.5 threshold might not be optimal. Consider threshold tuning:
from sklearn.metrics import precision_recall_fscore_support

# Try different thresholds
for threshold in [0.3, 0.4, 0.5, 0.6, 0.7]:
    y_pred_thresholded = (y_pred_proba >= threshold).astype(int)
    precision, recall, f1, _ = precision_recall_fscore_support(
        y_test, y_pred_thresholded, average='binary'
    )
    print(f"Threshold {threshold}: Precision={precision:.3f}, Recall={recall:.3f}, F1={f1:.3f}")

# Output:
# Threshold 0.3: Precision=0.728, Recall=0.905, F1=0.807
# Threshold 0.4: Precision=0.761, Recall=0.730, F1=0.745
# Threshold 0.5: Precision=0.836, Recall=0.689, F1=0.756
# Threshold 0.6: Precision=0.855, Recall=0.635, F1=0.729
# Threshold 0.7: Precision=0.905, Recall=0.514, F1=0.655
4. Context Matters
In the Titanic context, I might weight recall (finding actual survivors) higher than precision, but in a different scenario, the balance might shift.
Final Thoughts: F1-Score in the ML Lifecycle
Understanding F1-Score was crucial for my Titanic project and has become part of my standard evaluation toolkit. I now consider it during these phases:
- Phase 1 (Problem Definition): I think about whether precision, recall, or their balance matters most for my use case
- Phase 4 (Model Development): I optimize for F1-Score when appropriate
- Phase 5 (Model Evaluation): I use F1-Score alongside other metrics for comprehensive evaluation
- Phase 7 (Monitoring): I track F1-Score over time to detect performance degradation
F1-Score isn’t the only metric you need, but it’s a valuable tool for balancing precision and recall, especially in imbalanced datasets like the Titanic survival problem. It helped me build models that perform well not just on paper (high accuracy) but in practical terms (finding the right balance between catching survivors and not over-predicting survival).
Like with most ML concepts, the key is understanding when and why to use it, not just how to calculate it. The F1-Score gave me a more nuanced view of my model’s performance and helped me build a model that would actually be useful in a real-world scenario.