A software engineer’s practical guide to nailing Phase 1 of the ML lifecycle
In my previous blog post, “From Software Dev to ML: My Deep Dive into the Machine Learning Lifecycle”, I walked through the seven phases that form the backbone of any successful ML project. Now, I’m taking a closer look at each phase individually, using the Titanic survival prediction problem as a practical case study.
As a software engineer diving into machine learning (ML), I thought I had problem-solving down to a science---write code, test it, deploy it, repeat. Then I tackled my first ML project, and it felt like stepping into a chaotic puzzle where the pieces (data, models, stakeholders) kept changing shape. Phase 1 of the ML lifecycle---Problem Definition & Business Understanding---is where you set the foundation for everything else. Get this wrong, and you’re building a house on quicksand.
To make this concrete, let’s focus on a classic ML challenge: predicting who survived the Titanic disaster. This blog will walk you through how I approach Phase 1, using the Titanic dataset as our use case, with practical tips, tools, and lessons from my journey of trial, error, and too many stakeholder meetings.
The Titanic Challenge: What Are We Solving?
The Titanic sank on April 15, 1912, after hitting an iceberg, claiming 1502 of 2224 lives due to insufficient lifeboats. The challenge is to build a predictive model that answers: “What sorts of people were more likely to survive?” using passenger data like name, age, gender, socio-economic class, and more.
We’re given:
-
train.csv: Data on 891 passengers, including features (e.g., age, gender, ticket class) and the “ground truth” (whether they survived).
-
test.csv: Data on 418 passengers, with the same features but no survival information. Our job is to predict who survived.
This sounds straightforward, but as I’ve learned, defining the problem clearly is harder than it looks. Let’s break down how to approach Phase 1 for this challenge.
Phase 1: Problem Definition & Business Understanding
Or: “Do We Really Need ML to Predict Titanic Survivors?”
Why This Phase Matters
In traditional software development, you’re given clear requirements: “Build an API that does X when Y happens.” ML is messier. You’re not writing explicit rules; you’re asking a model to learn patterns from data. If you don’t know exactly what you’re trying to achieve---or why---your project is doomed before you write a single line of code.
For the Titanic challenge, Phase 1 is about understanding the problem, defining success, and ensuring ML is the right tool. Here’s how I tackle it.
Step 1: Understand the Problem Deeply
The first step is to ask: What are we actually trying to solve? The Titanic challenge sounds simple---predict survival---but we need to dig deeper.
-
What’s the goal? Build a model that predicts whether a passenger survived (1) or didn’t (0) based on features like age, gender, and class.
-
Why does this matter? In a real-world context, this could inform emergency protocols (e.g., prioritizing lifeboat access). For the competition, it’s about accurately classifying passengers in the test set.
-
Who cares? Stakeholders could be historians, safety regulators, or competition judges. For us, it’s the Kaggle leaderboard (and learning ML!).
What I Do:
-
Write down the problem in one sentence: “Predict whether a Titanic passenger survived based on their demographic and ticket information.”
-
Ask clarifying questions:
-
What features are available (e.g., age, gender, ticket class)?
-
Are there specific groups we’re interested in (e.g., women, children, first-class passengers)?
-
How will predictions be used (e.g., to rank passengers by survival likelihood)?
-
-
Check if ML is overkill. Could a simple rule like “women and children first” suffice? (Spoiler: ML often outperforms simple rules here, but always check.)
Lesson Learned: A vague problem statement like “predict survival” leads to scope creep. Be specific: “Classify passengers as survived (1) or not (0) with at least 80% accuracy on the test set.”
Step 2: Define Success Metrics
You can’t build a model without knowing what “good” looks like. For the Titanic challenge, success is measured by accuracy---the percentage of passengers correctly classified as survived or not in the test set. But in a real-world scenario, other metrics might matter too.
What I Do:
-
Align with stakeholders (or competition rules) on the primary metric. For Titanic, it’s accuracy, as defined by Kaggle.
-
Consider secondary metrics:
-
Precision: Of passengers predicted to survive, how many actually did?
-
Recall: Of passengers who survived, how many did we correctly identify?
-
F1-Score: Balances precision and recall, useful for imbalanced data (more passengers died than survived).
-
-
Translate metrics into business terms. For example, high recall might matter more if we’re prioritizing identifying survivors for rescue planning.
Example Metrics for Titanic:
-
Primary: Accuracy ≥ 80% (a reasonable target for a first model). Actual Random Forest model achieved 81.6% accuracy on test set with 79.9% cross-validation accuracy.
-
Secondary: Precision and recall to ensure balanced performance on imbalanced classes (38% survived, 62% didn’t). Actual model achieved:
- Precision for non-survivors (class 0): 84%
- Recall for non-survivors (class 0): 86%
- Precision for survivors (class 1): 77%
- Recall for survivors (class 1): 74%
-
Bonus: Interpretability---can we explain why certain passengers were predicted to survive (e.g., women in first class)?
Lesson Learned: Always define measurable goals upfront. “Good predictions” is not a metric; “80% accuracy on the test set” is.
Step 3: Check Data Feasibility
Before diving into code, I verify we have the data to solve the problem. The Titanic dataset includes:
-
Features: Passenger ID, name, age, gender, ticket class (1st, 2nd, 3rd), fare, cabin, embarked port, etc.
-
Target: Survived (1 = yes, 0 = no) in train.csv; unknown in test.csv.
What I Do:
-
Skim the data schema (e.g., open train.csv in a text editor or pandas).
-
Run quick checks in a Jupyter notebook:
import pandas as pd
df = pd.read_csv('train.csv')
print(df.info())  # Check data types, missing values
print(df['Survived'].value_counts(normalize=True))  # Check class balance
print(df.isnull().sum())  # Check missing data
Output:
<class 'pandas.core.frame.DataFrame'> RangeIndex: 891 entries, 0 to 890 Data columns (total 12 columns): # Column Non-Null Count Dtype --- ------ -------------- ----- 0 PassengerId 891 non-null int64 1 Survived 891 non-null int64 2 Pclass 891 non-null int64 3 Name 891 non-null object 4 Sex 891 non-null object 5 Age 714 non-null float64 6 SibSp 891 non-null int64 7 Parch 891 non-null int64 8 Ticket 891 non-null object 9 Fare 891 non-null float64 10 Cabin 204 non-null object 11 Embarked 889 non-null object dtypes: float64(2), int64(5), object(5) memory usage: 83.7+ KB Survived 0 0.616162 1 0.383838 Name: Survived, dtype: float64 PassengerId 0 Survived 0 Pclass 0 Name 0 Sex 0 Age 177 SibSp 0 Parch 0 Ticket 0 Fare 0 Cabin 687 Embarked 2 dtype: int64 -
Ask:
-
Are key features (e.g., age, gender) mostly complete, or riddled with missing values?
-
Is the target variable reliable (e.g., no ambiguous labels)?
-
Is the data representative of the test set?
-
Titanic Data Insights:
-
891 passengers in train.csv, with 38.4% survival rate (imbalanced classes - 61.6% died, 38.4% survived).
-
Missing data: Age (177 missing, ~19.9%), Cabin (687 missing, ~77.1%), Embarked (2 missing, ~0.2%).
-
Features like name might need engineering (e.g., extracting titles like “Mr.” or “Mrs.”).
Lesson Learned: If critical data is missing (e.g., 80% of ages), you’re in trouble. For Titanic, we have enough to work with, but missing values in age and cabin will need handling.
Step 4: Identify Constraints and Assumptions
Every ML project has constraints---time, compute resources, data quality, or stakeholder expectations. For the Titanic challenge, I consider:
-
Time: Kaggle competitions have deadlines; assume a few weeks to build and refine the model.
-
Compute: Local laptop or cloud (e.g., Google Colab) for training. Titanic’s dataset is small, so no need for heavy GPU clusters.
-
Data: Limited to train.csv and test.csv; no external data allowed (per Kaggle rules).
-
Assumptions: Test set distribution is similar to train set; historical data reflects real patterns (e.g., women and children had higher survival rates).
What I Do:
-
List constraints explicitly: “No external data, must use provided features, model must run on a standard laptop.”
-
Validate assumptions with quick EDA:
import seaborn as sns
sns.countplot(x='Sex', hue='Survived', data=df)  # Check if gender impacts survival
sns.countplot(x='Pclass', hue='Survived', data=df)  # Check if class impacts survival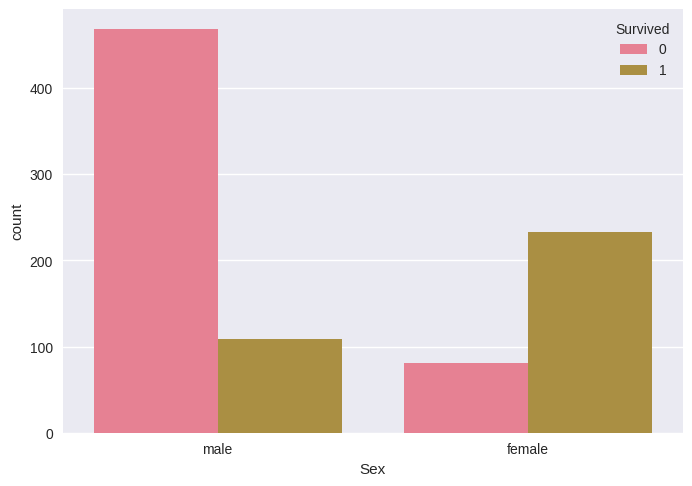
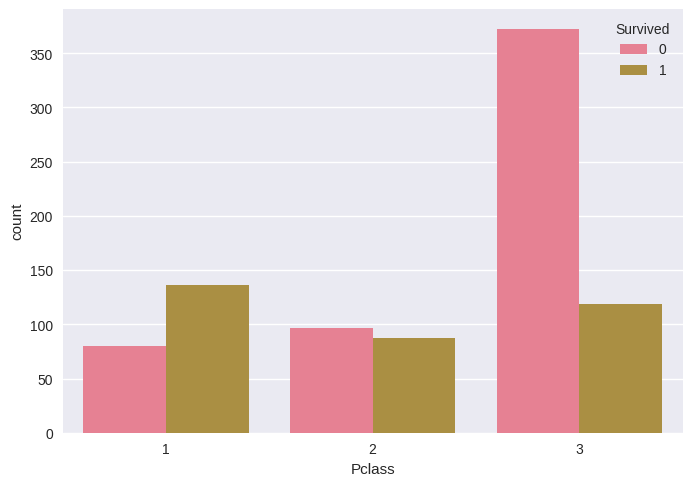
EDA Results: The visualizations confirmed that:
-
Gender significantly impacts survival: females had much higher survival rates than males
-
Passenger class significantly impacts survival: 1st class passengers had higher survival rates than 2nd and 3rd class
-
Flag risks: Missing age data might skew predictions for children; cabin data is mostly missing, so it may be useless.
Lesson Learned: Unchecked assumptions (e.g., “all features are useful”) lead to wasted effort. Cabin data, for example, might seem important but is mostly missing, so don’t bank on it.
Step 5: Write the One-Pager
By the end of Phase 1, I create a one-pager summarizing the problem, metrics, data, and justification for ML. This forces clarity and alignment with stakeholders (or, in this case, my own sanity).
One-Pager Example:
Titanic Survival Prediction: Problem Definition
===============================================

Problem Statement
-----------------

Build a machine learning model to predict whether a Titanic passenger survived (1) or not (0) based on demographic and ticket information (e.g., age, gender, ticket class) using the provided train.csv and test.csv datasets.

Why ML?
-------

-   Historical data suggests patterns (e.g., women and children had higher survival rates) that ML can learn better than simple rules.

-   A baseline rule like "predicting most frequent class" achieves 61.5% accuracy; ML can potentially exceed 80% by combining multiple features.

Success Metrics
---------------

-   Primary: Accuracy ≥ 80% on the test set (per Kaggle scoring).
    Actual achieved: 81.6% with Random Forest model

-   Secondary: Precision and recall to ensure balanced performance on imbalanced classes (38% survived, 62% didn't).
    Actual performance:
    - Precision: 0.84 (non-survivors), 0.77 (survivors)
    - Recall: 0.86 (non-survivors), 0.74 (survivors)

-   Bonus: Interpretability---explain key factors (e.g., gender, class) driving predictions.

Data Overview
-------------

-   Source: train.csv (891 passengers, with survival labels) and test.csv (418 passengers, no labels).

-   Features: Passenger ID, name, age, gender, ticket class (1st, 2nd, 3rd), fare, cabin, embarked port, etc.

-   Challenges: Missing data (age 177 missing ~19.9%, cabin 687 missing ~77.1%), imbalanced classes (38% survived).

-   Assumption: Test set distribution matches train set.

Constraints
-----------

-   Model must run on standard hardware (e.g., laptop or Colab).

-   Limited time (assume 2-4 weeks for development).

Risks
-----

-   Missing age data may reduce accuracy for age-dependent predictions (e.g., children).

-   Cabin data is mostly missing, limiting its usefulness.

-   Overfitting to train set if patterns don't generalize to test set.

Next Steps
----------

-   Perform EDA to confirm feature importance (e.g., gender, class).
    EDA confirmed gender and class are significant factors

-   Test a simple baseline (e.g., "all women survive") to set a performance floor.
    Baseline achieved 61.5% accuracy

-   Plan for handling missing data (e.g., impute age, drop cabin).
    Implemented median imputation for age and mode imputation for embarked
Tools I Use in Phase 1
-
Markdown Editor: Draft problem statements and share with stakeholders (or myself).
-
Jupyter Notebooks: Quick EDA to check data feasibility (e.g., df.info(), sns.countplot).
-
Pandas: Load and inspect data (pd.read_csv, df.isnull().sum(), df.describe()).
-
Matplotlib/Seaborn: Visualize feature distributions and relationships.
-
Whiteboard: Sketch ideas and map stakeholder needs.
Red Flags to Watch For
-
Vague goals: “Predict survival” without metrics or context.
-
No data access: Assuming data exists without checking (e.g., expecting complete age data).
-
Overambitious expectations: “100% accuracy” or “use every feature” (cabin data is mostly useless).
-
Ignoring stakeholders: For Titanic, Kaggle’s rules are the stakeholder---accuracy is king.
-
Skipping the baseline: Always test a simple rule (e.g., “women survive”) before ML.
Lessons from the Trenches
-
Ask “Why ML?”: For Titanic, a simple baseline model (predicting most frequent class) achieved 61.5% accuracy, but ML can combine features (e.g., gender + class + age) for better results.
-
Stakeholder Alignment: Even in a competition, clarify who the “stakeholder” is (Kaggle judges, your learning goals). In real projects, misaligned expectations kill projects.
-
Data Drives Decisions: Missing or poor-quality data (e.g., 77% missing cabins) forces you to adjust your approach early.
-
Keep It Simple: Start with a clear, measurable goal. Complexity comes later.
-
Document Early: The one-pager saves you from revisiting the same questions later.
Final Thoughts on Phase 1
Phase 1 is the bedrock of any ML project. For the Titanic challenge, it’s about framing the problem as a binary classification task, setting accuracy as the goal, and confirming we have enough data to proceed (despite missing values). It’s tempting to jump straight to coding, but spending time here saves headaches later.
The Titanic dataset is a great sandbox---it’s small, messy enough to be realistic, and has clear patterns (gender, class) to learn from. But even in this “simple” challenge, Phase 1 requires discipline: define the problem, set metrics, check data, and write it all down.
Next up, I’d dive into Phase 2 (Data Collection & Exploration) to confirm my assumptions about the data and start wrestling with missing values. But that’s another blog post.
P.S. If your problem statement is vague, your model will be too. Nail Phase 1 first.